PUBLIC LIGHTING
Digital complaints handling and energy GIS for public lighting in Sousse
In the decade following Tunisia’s democratic transition, national open-government commitments encouraged municipalities to make citizen feedback more transparent and traceable. In Sousse, complaints about local services arrived via scattered phone calls and counter visits, with limited visibility for residents or managers and no consolidated map of where problems occurred.
The municipality responded by building a simple digital complaints channel linked directly to its geographic information system (GIS). Residents can now submit and track “réclamations” online, while technical teams see tickets on the same spatial layers they use for asset management, especially for public lighting. Within the same GIS environment, Sousse operates an energy dashboard for street lighting that inventories cabinets and lighting points and ingests data from new smart meters, turning electricity use and CO₂ indicators into everyday management tools.
Challenges addressed
Before the reform, complaint handling in Sousse was fragmented and largely analogue. Residents had to phone or visit different offices, often without any acknowledgement or ability to follow up, and managers lacked a consolidated overview of where problems were recurring.
At the same time, the city operated a substantial public-lighting network without a unified, spatially explicit inventory of cabinets, lighting points and consumption, which hindered planning and made it difficult to link citizen feedback to specific assets. The absence of a shared GIS-based view limited the municipality’s capacity to prioritise interventions, monitor performance and communicate progress in line with Tunisia’s open-government commitments.
Main objectives
The main objective is to provide a single, user-friendly digital entry point for complaints that feeds directly into Sousse’s GIS, so that issues can be mapped, prioritised and resolved in a coordinated way. At the same time, the city aims to use the same GIS environment to manage public lighting as an energy system: maintaining an operational inventory of cabinets and lighting points, monitoring consumption with smart meters and tracking CO₂ indicators.
Together, the complaints app, geoportal and energy dashboard are intended to create a transparent loop from citizen reports to asset management and energy performance, while strengthening data governance and continuity practices inside the municipality.
External resources
Facts
Project type Web-based complaints portal (“Réclamations”) integrated with a municipal ArcGIS Hub and a GIS-based energy dashboard for public lighting, including deployment of remote-reading “compteurs astronomiques intelligents” on selected cabinets and municipal buildings.
Partners The initiative is led by the Municipality of Sousse within the framework of its urban digitalisation and open-government efforts, drawing on technical work documented in the SIG de la Ville de Sousse: Rapport d’étude prepared under the PDUI programme. The GIS environment is built on Esri technologies (municipal geoportal and ArcGIS Hub), which support both internal dashboards and the public-facing complaints and mapping interfaces.
Funding The GIS and energy-dashboard work is associated with the PDUI 2022 study on the Sousse municipal GIS, supported by external cooperation partners and municipal resources. Smart meters and dashboards for public lighting are financed through the city’s energy and infrastructure budgets, with technical assistance channelled via the PDUI framework.
Project description
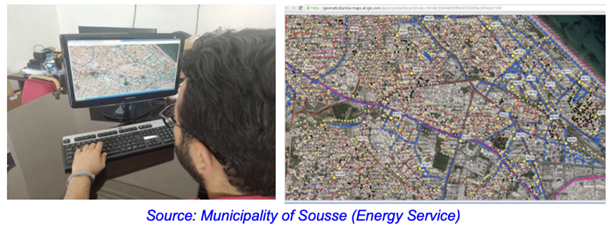
Sousse created a web pathway called “Réclamations”, accessible from the municipal site, where residents choose a service category, describe the issue, attach a photo and geolocate the incident; they can then follow the status of their case online as it moves from receipt to resolution. The same form is published via the city’s ArcGIS Hub, which exposes survey endpoints and API links in line with a data-by-default approach. The complaints flow is tied to the municipal GIS, which includes a dedicated “réseau d’éclairage public” layer and a staff dashboard. A specific application lets residents report street-lighting breakdowns and track treatment in real time, while technicians see tickets and assets on a shared map.
Within this GIS environment, Sousse also operates an energy dashboard for public lighting that inventories 221 cabinets, 16 819 lighting points and 15 681 foyers, and that links directly to the complaints app. To monitor performance, the city is deploying smart astronomical meters that read indexes remotely and feed real-time electricity consumption, network-stability and CO₂ indicators into configurable dashboards; the first 23 units were installed across municipal buildings and lighting cabinets, along with one unit for a photovoltaic installation at Hmadet Douik.
Impact and results
Early experience suggests that connecting complaints and assets in one GIS has improved acknowledgement and prioritisation: residents receive clearer feedback on their requests, while managers can see clusters of issues and plan interventions rather than treating reports in isolation. The public geoportal makes many layers discoverable to citizens and partners and anchors communication around a shared spatial reference, supporting Tunisia’s open-government agenda.
On the energy side, the dashboard and smart meters create, for the first time, a consolidated picture of public-lighting infrastructure and consumption, enabling the city to monitor electricity use, identify anomalies and track CO₂ indicators across cabinets and sites. By closing the loop from citizen reports to network data and performance metrics, Sousse is building a transparent, data-driven approach to both service quality and energy management that can be extended to additional layers over time.
Publications & main documents
RELATED CONTENT
Sorry, no posts matched your criteria.

